
Despite trading volumes being slightly lower in Q2 2020 than in Q1, Bitcoin displayed one of the best quarters in its history, with a 3-month price increase of +42%.
ETH outperformed BTC while DeFi-related assets displayed substantial price returns, as best illustrated by LEND and BNT. The launch of COMP, the governance token of Compound, brought it to the top 30 of CoinMarketCap.
Except Cardano (ADA), most other large-cap assets displayed lower than average quarterly performance amidst lower volumes.
Correlations remained high in the crypto industry but slightly lower than in the first quarter in 2020. The rolling 90-day correlation between S&P 500 and BTC remained significant and positive. However, its strength decreased sharply in the second half of June.
Binance Futures' Open Interest increased significantly in Q2 2020 and reached a new high of 560mm USDT in June. Yet, it remains dominated by the BTC/USDT perpetual contract, making 65% of the platform's OI.
Macro overview
Trading volumes were slightly lower in the second quarter of 2020 than in the first quarter, with a particularly distinct downward trend for large-cap assets (excluding Bitcoin & Ethereum). Similarly, all Q2 top performers were mid-cap altcoins, such as LEND, BNT, ERD, and EDO. Each of these assets gained close to or more than +500%.
While Bitcoin’s performance was +42% in Q2, most of its price appreciation occurred in the first 45 days of the second quarter. To use CNBC’s analogy, Bitcoin’s price has moved like a kangaroo for the past 45 days, moving between $8,700 and $10,200, failing twice to maintain itself above the $10,000 mark.
A kangaroo market refers to a market environment where prices move up and down over a specific period, without any strong directional uptrend or downtrend.
Amidst this unusual pattern, ETH outperformed BTC, displaying a +69.7% quarterly return, possibly driven by the growth of DeFi and the anticipation of ETH 2.0. Meanwhile, XRP’s price development was flat, with a price return of only +0.5% and overall volumes down by more than -50% (QoQ). In the top ten crypto markets, ADA (Cardano) was one of the only assets to display a 3-digit price return, with a quarterly return of 173.8% (yet with a total volume increase of only +43.4%).
Consistently, the volatility of the crypto market was highest at the beginning of Q2. This can be seen by focusing on the volatility index of Bitcoin. By comparing BitMEX’s Bitcoin volatility index (.BVOL) with the CBOE’s VIX, it can further be seen to what extent the derivatives market of the Bitcoin and S&P 500 index were comparable. Before doing this, one ought to adjust for the fact that .BVOL is a historical index, assessing past volatility, whereas, VIX assesses implied volatility.
.BVOL shows a quarterly peak on April 7th (.BVOL index value of 171.15), closing this quarter with a price of ~23% of the Q2 ATH (i.e., a .BVOL index value of 39.2). Similarly, VIX peaked earlier (March 16th) and started this quarter at 57.6 to subsequently climb down to 30.4 on June 30. As VIX is calculated from options with maturities between 23 days and 37 days, it is apparent that the indices moved similarly.
The S&P 500 quickly rebounded after March’s low and had a historically good performance, surging by almost 20% for the April through June quarter. This performance is generally considered a consequence of an infusion of fiscal and monetary stimulus into an economy where “uncertainty and volatility are likely to remain high”.
This is also reflected in the 90-day rolling correlations between the S&P 500 and BTC. In that regard, correlation coefficients temporarily jumped, most likely because of a COVID-19-induced flight into very liquid assets (e.g., cash).
However, despite our initial expectation, BTC still displays a (small yet) positive correlation with the S&P500, often above 0.4. However, it significantly dropped at the end of the quarter.
QoQ crypto asset correlations slightly decreased but remained high, with the two most correlated asset pair being EOS with Ethereum (ETH) (0.93).
Futures traded on Binance further grew with open interest reaching a new ATH of USDT 560mm and BTC’s perpetual contracts only accounting for an average 35% of trading volumes (down from 82% in January).
On a more granular level, Bitcoin’s price development might have been partially explained by the market anticipation of the halving (May 11th), a short rally until June 1st (breaking $10,000), and a few price corrections before entering in a narrow trading range.
Finally, in the two weeks after the Bitcoin halving, BTC’s total hashrate dropped by roughly 25% from an "almost-all-time-high" at the halving day (May 11th). However, the total hashrate quickly picked up, and ended Q2 at a new record high.
Other news
In the footsteps of Square, PayPal is widely expected to enter the crypto market, which would further set the table for mass adoption. According to a recent FCA survey, this mass adoption might already be happening in Great Britain, where the number of people holding cryptocurrencies is going up drastically: from 1.5m in 2019 to 2.6m in June 2020 - a YoY increase of almost 75%.
Reddit, the social discussion platform with over 400 million users, has introduced two ERC-20 tokens: Bricks () and Moons (). Currently running on the Rinkeby testnet, both tokens are expected to be migrated onto the mainnet by the end of the year.
DeFi also had a meteoric growth spurt (again!); the USD amount of assets locked in DeFi protocols jumped five-fold during Q2, from USD ~130m to USD ~550m. As some of these assets are WBTC, Ethereum’s “gravitational pull” on Bitcoin was broadly discussed.
In general, COMP, the governance token of the Compound protocol, made a remarkable debut, entering the top 30 largest assets by market capitalization.
The widespread uptake of DeFi is also evident in development activity and volumes of decentralized exchanges. DEX volumes surged similarly high as DeFi AUM, rising from USD ~0.65bn in April to USD ~1.5bn in June.
But crypto projects are not the only ones interested in innovating financial infrastructure: both commercial and central banks are also pushing ahead:
Goldman Sachs, for example, built an API-based transaction banking infrastructure, but does not use blockchain and - according to a client call from May 27 - remains skeptical on Bitcoin.
Some central banks, such as the Sverige Riksbank, share this skepticism and do not consider blockchain an inevitable part of its CBDC. However, most CBDCs do use blockchain and, according to a recent BIS survey, are increasingly popular.
The maturity of such CBDCs varies broadly: while the Chinese CBDC reportedly finished its backend architecture, other central bankers still assess the privacy of a CBDC with the Fed seemingly being in an early, conceptual stage.
Binance Trading comment
The second quarter of the year has historically always been the strongest for Bitcoin, and 2020 proved to be the same.
Table 1 - Historical Bitcoin quarterly returns in USD
Year | Q1 | Q2 | Q3 | Q4 |
|---|---|---|---|---|
2014 | -37.99% | 33.95% | -40.14% | -18.08% |
2015 | -21.31% | 4.59% | -8.15% | 82.84% |
2016 | -3.77% | 61.81% | -9.21% | 62.80% |
2017 | 8.23% | 125.32% | 80.89% | 210.13% |
2018 | -48.89% | -6.70% | 2.92% | -42.54% |
2019 | 8.90% | 157.54% | -21.50% | -13.60% |
2020 | -10.58% | 42.23% |
Sources: Skew, Binance Trading, Binance Research.
This uptick in Bitcoin and the crypto markets came as a relief after a tumultuous Q1, in which Bitcoin prices essentially halved on Black Thursday. Unsurprisingly, since the release of the Binance OTC Trading Portal (an automated RFQ platform) on April 2nd, the buy-sell ratio for Bitcoin has been skewed towards the buy side, coinciding with an increase in price. Overall, 61% of the total Bitcoin volumes in Q2 were buy flows.
What was surprising was the fact that flows were most skewed in the month of June, when Bitcoin traded in a fairly tight range. June also recorded the highest overall volumes for Bitcoin and 67% of these volumes were buy flows. We initially thought that buy flows would be higher in April when Bitcoin prices increased the most (from $6,600 to $8,900), or in May, when Bitcoin (BTC) had its halving.
The increase in overall volumes and a high buy-sell ratio in June look to bode well for Bitcoin, as it seems that traders are stocking up on Bitcoin. While the Bitcoin halving did not have as much impact so far in terms of price movement, the halvings in 2012 and 2016 saw significant upticks in price around six months after their respective halvings. It remains to be seen whether we will see a similar effect occur in 2020.
In terms of altcoins, the most heavily traded ones on the Portal were: (1) ETH, (2) BNB, (3) LTC, (4) EOS, and (5) XTZ.
Noticeably missing from the list was XRP, which came in at number 7 after LINK. Interestingly, this breakdown did not match the ranking of price returns in the second quarter of 2020, since LINK and ADA were the most popular performing large-cap assets in Q2.
Anyone who makes a trade on the Binance OTC Portal before July 20 can receive a VIP +1 upgrade! - Please check out our announcement here. By using the OTC Portal, traders can limit slippage on block trades and receive quick (usually instant) settlement, all with zero trading fees. If you have any questions, please feel free to reach out to one of our authorized traders on the Binance Trading Telegram channel or send an email to tradedesk1@binance.com
Spot market movements
Table 2 - Q2 2020 performance of top 10 large-cap cryptoassets on Binance
Source: Binance.
Table 3 - Q2 2020 - Top movers on Binance.com
Asset/Ticker | Price change |
|---|---|
+669.0% | |
+561.9% | |
+506.4% | |
+474.8% | |
+380.4% |
Source: Binance.
Altcoins were the top performers. Elrond (ERD) displayed an abnormous performance, with its price increasing by more than 7-fold, likely tied to its upcoming mainnet launch.
Similarly, LEND (Aave Protocol), BNT (Bancor), and EDO (Eidoo), three assets in the DeFi space on Ethereum, displayed some of the top performances with respective quarterly price increases by more than +470%.
As of July 7th 2020, LEND trades at levels that had not been seen since February 2018.
Amidst the wave of partnerships (e.g., Google Cloud) for Theta Network, TFUEL, its utility asset went up as well, before facing a correction price movement.
Table 4 - Q2 2020 - Worst performers on Binance.com
Asset/Ticker | Price change |
|---|---|
-11.4% | |
-8.4% | |
-7.7% | |
0.04% | |
0.52% |
Source: Binance.
Interestingly, only three crypto assets listed on Binance displayed a negative performance: MCO, TNT, and STPT. The other worst two price performers were BRD (Bread) and XRP, yet, had slight positive gains.
A look at Bitcoin’s dominance
This most recent quarter was marked by a noticeable decline in Bitcoin spot trading dominance as ETH’s rally continued through Q2, coinciding with relative increases in trading of altcoins, including LINK and ADA. With market dominance holding flat in the low 60% range, the EOQ sharp decline in spot trading dominance stood out as the market-trading dominance ratio reached 2.69, the high for the past year.
Chart 1 - Bitcoin spot trading dominance (%) on Binance.com

Source: Binance Research.
Chart 2 - Bitcoin market dominance (%) from CoinMarketCap

Source: Binance Research, CoinMarketCap.
Chart 3 - Ratio of weekly market dominance by trading dominance
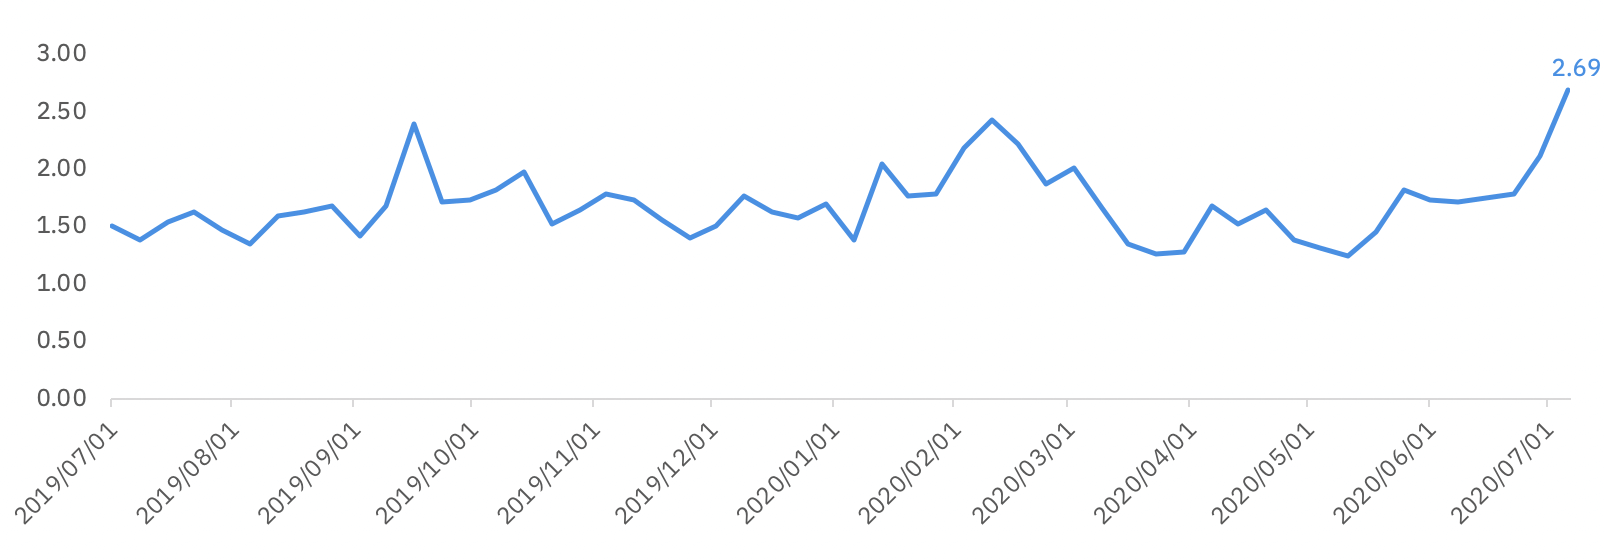
Source: Binance Research.
Listing on Binance.com in Q2 2020
Table 5 - New listings on Binance.com in Q2 2020
Asset/Ticker | Pair asset | Date |
|---|---|---|
BTC, ETH, BNB | 2020/04/06 | |
BNB, BTC, BUSD | 2020/04/09 | |
Indonesian Rupiah (IDRT) | BNB, BTC, USDT, BUSD/ | 2020/04/17 |
BNB, BTC, USDT, BUSD | 2020/04/23 | |
BNB, BTC, USDT | 2020/04/26 | |
BNB, BTC, USDT | 2020/05/07 | |
BNB, BTC, USDT | 2020/06/05 | |
BNB, BTC, ETH, USDT | 2020/06/11 (token swap) | |
BNB, BUSD | 2020/06/18 | |
BTC, BNB, BUSD | 2020/06/22 | |
BTC, BNB, BUSD, USDT | 2020/06/25 |
Source: Binance.
In addition to these assets, two leveraged tokens were also added on Binance.com: BTCUP and BTCDOWN.
Correlations in Q2 2020
Crypto correlations
Chart 4 - Q2 2020 correlations in USD daily returns amongst large-cap cryptoassets

Source: Binance Resarch. Data from CoinMarketCap.
Correlations remain high in the crypto space for high cap cryptocurrencies, but have decreased compared to the first quarter of 2020. For instance, BTC displayed a correlation with ETH of 0.85, while XRP remains remarkably correlated with ETH (0.86) and BCH (0.85). In Q1 2020, Bitcoin and Ethereum displayed a correlation coefficient of 0.93.
Litecoin (LTC) was the most correlated with the other large-cap assets, displaying an average correlation coefficient of 0.84. Conversely, Chainlink (LINK) turned out to be the least correlated asset. Yet, this hardly made LINK a diversifier with a significantly positive average correlation of 0.66 with other assets, and a minimum correlation coefficient of 0.58 (with XLM).
The two most correlated assets were EOS and Ethereum (ETH), which displayed a price return correlation coefficient of 0.93. Furthermore, in spite of its outperformance in Q2, Cardano (ADA) remains very correlated with other assets like Ethereum (0.80).
Cross asset correlations
Table 6 - Q2 2020 return across major assets
Bitcoin | S&P 500 | Russell 2000 | Gold | Silver | Oil |
|---|---|---|---|---|---|
+42.23% | +19.95% | +25.00% | +13.06% | +31.62% | +95.90% |
Sources: Binance Research, Yahoo Finance.
Chart 5 - 90-day correlation between gold and Bitcoin daily returns over 1 year

Sources: Binance Research, Yahoo Finance.
The 90-day rolling correlation between gold and Bitcoin daily returns indicates no clear relationship between the two assets for the observed period. The upper bound of the correlation coefficient was at 0.23 in September 2019, with the lower bound being at -0.11 in June 2020.
While the chart implies a general trend from being positively correlated to being negatively correlated, such low correlation coefficients are primarily noise, and can not be considered significant. Subsequently, it can be concluded that Bitcoin and gold do not move together and are thus influenced by various sets of idiosyncratic factors.
Chart 6 - 90-day rolling correlation between BTC and S&P 500 daily returns over 1 year

Sources: Binance Research, Yahoo Finance.
Applying the same methodology to BTC and S&P 500 daily returns shows a different picture. After a long period (~ 8 months) of very low to no correlation, the correlation coefficient jumps to almost 0.6 in February/ March 2020. It plateaued at this level to subsequently fall at the end of June 2020.
One likely interpretation is that Bitcoin mirrored the performance of the distressed financial equity market in the U.S, while COVID-19 created high uncertainty and induced a flight into liquid assets. It further appears as if that correlation shrunk down to pre-COVID-19 levels in late June. It is to be seen to what extent this is a brief outlier or a return to a more “normal” situation, within which BTC and the S&P 500 are not correlated.
Binance Futures and derivatives
In Q2 2020, Binance Futures launched its second flagship product, quarterly futures. These are an important addition to the existing futures trading ecosystem at Binance.
Table 7 - New quarterly futures contracts on Binance Futures
Contract | Inception | Leverage |
|---|---|---|
June 11th | 125x | |
July 1st | 125x |
Since its inception, the quarter futures contracts have processed more than $4.4 billion in volume, with over $100 million in volume traded on its debut.
In Q2 2020, Binance Futures has grown tremendously, processing over $332 billion in volume (vs. $562 billion YTD). The exchange recorded one of its highest volumes in May, with over $45.5 billion worth of perpetual contracts traded in a single week. Binance Futures displayed a weekly average volume of $24.7 billion in Q2 2020.
Chart 7 - Historical weekly volume traded across perpetual contracts (in USD billion)

Sources: Binance Research, Binance Futures.
The aggregated volume on Binance Futures has been more diversified across Bitcoin and altcoin contracts. In January, Bitcoin’s perpetual contracts dominated trading volumes as much as 82%. As new altcoin contracts were gradually introduced, the altcoin volume percentage increased correspondingly, even recording a high of 53% in mid-February, before normalizing to an average of 35% in Q2 2020.
Chart 8 - Volume breakdown between Bitcoin contracts vs. altcoin contracts (weekly)
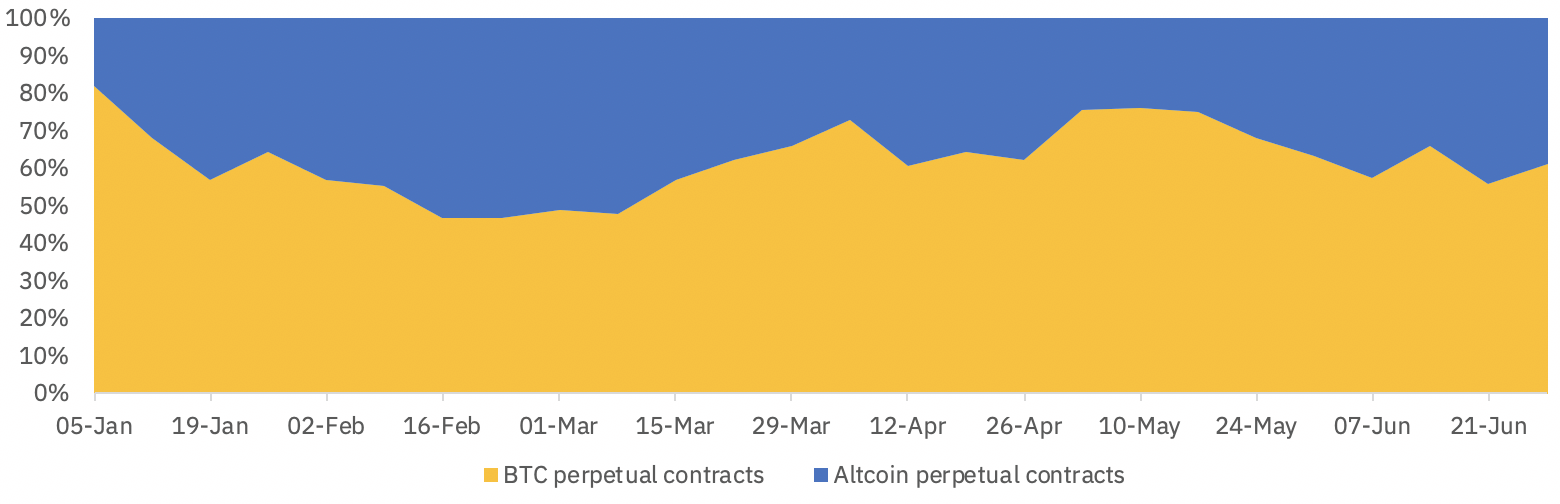
Sources: Binance Research, Binance Futures.
The aggregated open interest on Binance Futures has grown consecutively since the crypto crash in March 2020. In Q1, the open interest expanded from 150 mm USDT in January to 400 mm USDT in February before capitulating more than 60% in March as waves of selling frenzy hit the markets. Since then, the open interest has recovered and grown gradually, marking a new high of 560mm USDT in June.
Chart 9 - Historical open interest on Binance Futures (weekly) in USD million

Sources: Binance Research, Binance Futures.
Similar to volume trends, altcoin’s open interest has gained a foothold since Q2 2020, representing an average of 35% of the total open interest. Meanwhile, Bitcoin remained the most invested contract, comprising 65% of the platform’s total open interest.
Chart 10 - Open interest breakdown between Bitcoin contracts vs. altcoin contracts (weekly)

Sources: Binance Research, Binance Futures.